TROPICAL CYCLONES

The schematic below summarizes our previous research on tropical cyclones in vertical wind shear (in collaboration with M. T. Montgomery, NPS, Monterey, CA, USA; Riemer et al. 2010, Riemer and Montgomery 2011, Riemer et al. 2013). Click here for more details.
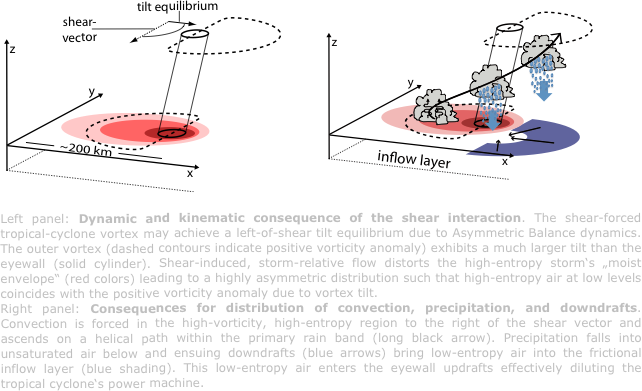
Currently, I am interested in the Lagrangian description of „ventilation“, i.e. the intrusion of low-entropy air from the environment into the inner-core convection. Intrusion is most significant in vertically-sheared storms and these storms exhibit distinct asymmetric structure.
In a first study (Riemer and Laliberte, 2015, JAS), we examined trajectories calculated for the shear experiments of Riemer et al. (2010). Examination in physical (e.g. radius-height) space does not appear to provide a clear picture for two reasons: 1) Asymmetric storm structure makes radius as a coordinate rather ambiguous, and 2) geometric height (or pressure-based vertical coordinates) provide no clear distinction between the frictional boundary layer, the outflow layer, and the free troposphere. We find the examination of trajectories in thermodynamic (entropy-temperature) space to be very helpful. This framework relates to the axisymmetric, steady-state Potential Intensity theory and its recent extension to ventilated storms by Tang and Emanuel (2010,2012). We suggest that the mass flux in entropy-temperature space as a key diagnostic. Using this diagnostic, different ventilation pathways can be described quantitatively.
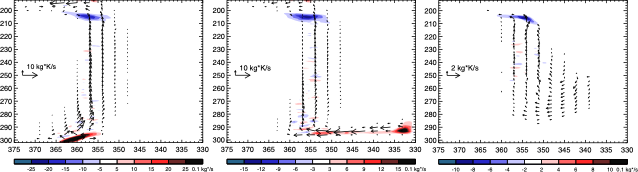
Air masses can enter the inner-core convection through different pathways. Illustration of distinct pathways that contribute to the secondary circulation of an idealized TC in vertical wind shear. The arrows depict the mass-weighted flow in entropy-temperature space derived from extensive trajectory calculations. Color shading depicts the divergence of this flow. Entropy is measured by equivalent potential temperature and is plotted on the abscissa (in [K]), temperature is plotted on the ordinate (in [K]). Distinct classes of trajectories are inidcated, here identified subjectively by distinct values of temperature and equivalent potential temperature at seeding time. The left panel depicts air parcels that start in the frictional inflow layer of the storm. Air parcels in the middle panel intrude into the eyewall updrafts from the environment at low levels but above the frictional inflow layer. In the right panel, air parcels intrude from the environment with cooler temperatures signifying a mid-level ventilation pathway.
