[Contents] [Index]
[Top] [Bottom] [Prev] [Next]
3. Cluster Information
This chapter is a detailed tutorial on how to use the LSF commands that report information about the LSF cluster. Cluster information includes:
- cluster status
- resource configuration
- host configuration
- host load levels
Cluster information is available through commands and a graphical user interface.
Finding the Master
The lsid command tells you the version of LSF, the name of the load-sharing cluster, and the current master host.
% lsid
LSF 3.1, Dec 1, 1997
Copyright 1992-1997 Platform Computing Corporation

My cluster name is sample_cluster
My master name is hostA
Listing Resources
The lsinfo command displays the resources, host types, and host models in the LSF cluster. See `Displaying Available Resources' on page 14 for an example of the lsinfo command.
The -l option to the lsinfo command displays all information available about load indices. You can also specify load indices on the command line to display information about the selected indices:
% lsinfo -l swp cs irix
RESOURCE_NAME:  swp
DESCRIPTION: Available swap space (Mbytes) (alias: swap)
TYPE      ORDER   INTERVAL  BUILTIN  DYNAMIC
Numeric   Dec     60        Yes      Yes

RESOURCE_NAME:  cpuf
DESCRIPTION:  CPU factor
TYPE      ORDER   INTERVAL  BUILTIN  DYNAMIC
Numeric   Dec     0         Yes      No

RESOURCE_NAME:  irix
DESCRIPTION: IRIX UNIX
TYPE      ORDER   INTERVAL  BUILTIN  DYNAMIC
Boolean   N/A     0         No       No
TYPE
Indicates whether the resource is numeric, string, or Boolean.
ORDER
Inc if the numeric value of the load index increases as the load
it measures increases, such as ut (CPU utilization). Dec
if the numeric value decreases as the load increases. N/A if the
resource is not numeric.
INTERVAL
The load index is updated every INTERVAL seconds. a value
of 0 means the value never changes.
BUILTIN
If BUILTIN is Yes, the resource name is defined
internally by the LIM. If BUILTIN is No, the resource
name is site-specific defined by the LSF administrator.
DYNAMIC
If DYNAMIC is Yes the resource value changes
over time. If DYNAMIC is No the resource represents
information that does not change such as the total swap space in the host.
Listing Hosts
A load-sharing cluster may consist of hosts of different architecture and speeds. The lshosts command displays static information about hosts.
% lshosts
HOST_NAME type   model    cpuf ncpus maxmem maxswp server RESOURCES
hostD     SUNSOL SunSparc 6.0  1     64M    112M   Yes   (solaris cserver)
hostB     ALPHA  DEC3000  10.0 1     94M    128M   Yes   (alpha cserver)
hostM     RS6K   IBM350   7.0  1     64M    124M   Yes   (cserver aix)
hostC     SGI6   ORIGIN2K 14.0 16    1024M  1896M  Yes   (irix cserver)
hostA     HPPA   HP715    6.0  1     98M    200M   Yes   (hpux fserver)
The fields displayed are:
type - the host CPU architecture. Hosts that can run the same binary programs should have the same type.
model and cpuf- the host model and relative CPU performance factor. The higher the number, the faster the CPU.
ncpus - the number of processors on this host.
maxmem - the maximum amount of physical memory available for user processes.
maxswp - the total swap space available.
server - Yes if the host is an LSF server, No if the host is a client.
RESOURCES - the boolean resources defined for this host.
All these parameters are defined by the LSF administrator in the LSF configuration files, or determined directly from the system.
The -l option to the lshosts command displays more detailed information about hosts, including the load thresholds. You can also use the -R resreq option to display hosts with specific resources, or specify hosts on the command line.
There is also the -w option which displays information in table format without truncating the fields. This is especially useful for scripts that parse the output of lshosts.
% lshosts -l hostC

HOST_NAME: hostC
type      model     cpuf ncpus ndisks maxmem maxswp  maxtmp rexpri server
SGI6      ORIGIN2K  14   16    4      1024M  1896M   120M   0      Yes

RESOURCES: irix cserver
RUN_WINDOWS:  (always open)
LOAD_THRESHOLDS:
r15s   r1m  r15m  ut    pg    io   ls   it   tmp   swp   mem
-      3.5  -      -     -     -    -    -    -     974M  451M
The extra fields displayed by the -l option are:
ndisks - the number of disk drives directly attached to the host
maxtmp - the size of the disk partition that contains the /tmp directory

rexpri - the execution priority of remote jobs run by the RES. rexpri is a number between -20 and 20, with -20 representing the highest priority and 20 the lowest. The default rexpri is 0, which corresponds to the default scheduling priority of 0 on BSD-based UNIX systems and 20 on System V-based systems.
RUN_WINDOWS
The time windows during which LIM considers the host as available to execute remote jobs.
Note
These run windows have the same function for LSF hosts as dispatch windows have for LSF Batch hosts.
LOAD_THRESHOLDS
The host is considered busy if any load index is above its threshold (or below, for decreasing load indices). LSF does not send interactive jobs to busy hosts. If the threshold is displayed as a dash `-', the value of that load index does not affect the host's status.
Displaying the Load
The lsload command prints out current load information.
% lsload
HOST_NAME status r15s r1m  r15m ut   pg     ls  it  tmp  swp  mem
hostD     ok     0.1  0.0  0.1  2%   0.0    5   3   81M  82M  45M
hostC     ok     0.7  1.2  0.5  50%  1.1    11  0   322M 337M 252M
hostM     ok     0.8  2.2  1.4  60%  15.4   0   136 62M  37M  44M
hostA     busy   *5.2 3.6  2.6  99%  *34.4  4   0   70M  34M  18M
hostB     lockU  1.0  1.0  1.5  99%  0.8    5   33  12M  24M  23M
The first line lists all the load index names. The load indices are described in `Load Indices' on page 37.
The status column gives the load status of the host. A host is busy if any load index is beyond its configured threshold. When a load index is beyond its threshold, it is printed with an asterisk `*'. In the above example, hostA is busy because load indices r15s and pg are too high.
By default hosts are sorted based on CPU and memory load, with the best host listed first. You can specify an order string using the -R resreq option to sort the hosts in other ways.
The -l option displays the values of all load indices, including external load indices. You can also specify host names on the command line to display the load of specific hosts. In this example nio is an external load index defined by the LSF administrator.
% lsload -l hostM
HOST_NAME  status  r15s r1m r15m ut   pg   io  ls it tmp  swp  mem  nio
hostM      lockW   0.7  0.5 0.1  21%  0.0  228 7  0  31M  52M  25M  3.5
The -l option displays the full host name, rather than truncating the name to fit in a limited screen width. The output from lsload -l is better suited for automatic processing, since the host name is always complete. It also shows all the load indices rather than just some of them.
The lsmon command provides an updating display of load information. An example display from lsmon is shown below. You can specify the resource requirements, refresh interval, and other parameters interactively or on the command line. See the lsmon(1) manual page for more information.
% lsmon hostA hostB
Hostname: hostA
Refresh rate:  10 secs

HOST_NAME  status  r15s   r1m  r15m   ut  pg   ls  it  swp   mem  tmp
hostB      ok      0.0    0.0  0.0    6%  0.0  7   45  82M   51M  206M
hostA      ok      0.2    0.2  0.1    5%  8.9  2   0   140M  70M  119M
Graphical Load Display
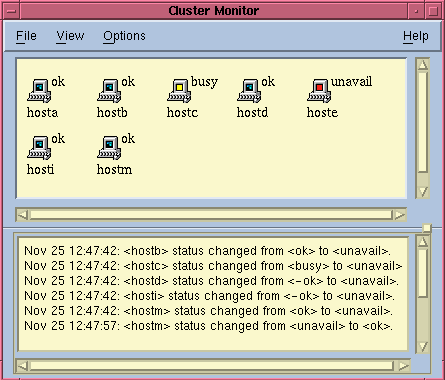
xlsmon is a graphical user interface (GUI) application that displays host status, load levels, load history, and LSF cluster configuration information. The xlsmon main window shows an icon for each host in the cluster, with each host labelled with its status. Hosts change colour as their status changes. The xlsmon main window is shown below.
Figure 5. xlsmon Main Window
Each xlsmon window has a "Help" menu item that calls up online help. For more information about using xlsmon, see the online help.
You can choose other displays from the "View" menu.
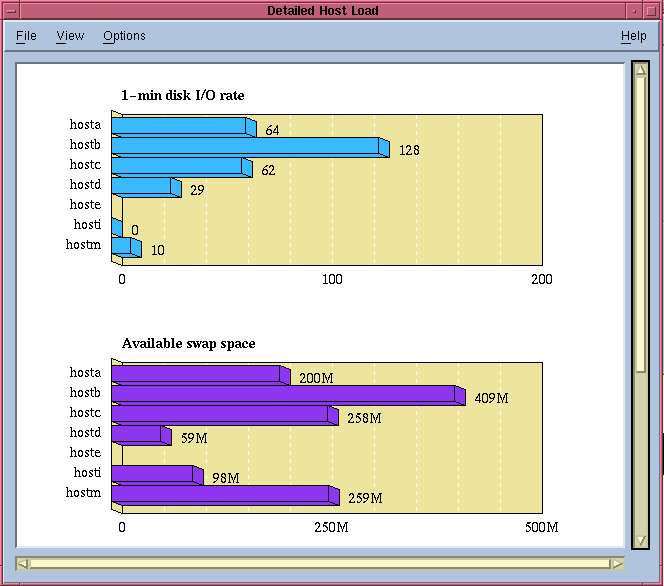
The `Detailed Host Load' window displays load levels as bar graphs. You can select which load indices and which hosts are displayed by choosing options from the "View" menu in the `Detailed Host Load' window.
Figure 6. xlsmon Detailed Host Load Window
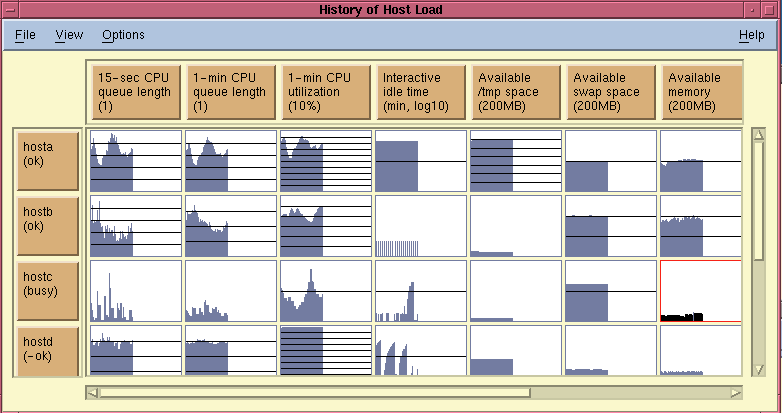
The `History of Host Load' window displays the load levels as stripcharts, so you can see the load history starting from when the `History of Host Load' window is first displayed. As with the `Detailed Host Load' window, you can select hosts and load indices by choosing options from the "View" menu.
Figure 7. xlsmon History of Host Load Window
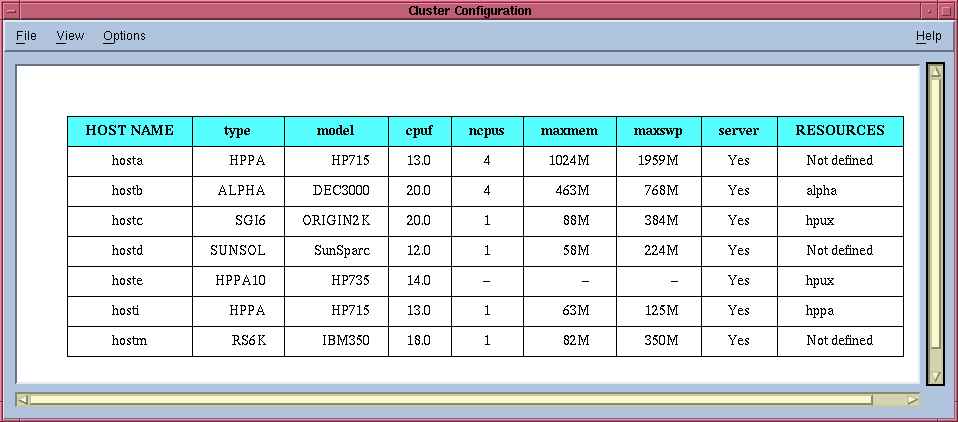
The `Cluster Configuration' window below, shows the same host information as the lshosts command displays.
Figure 8. xlsmon Cluster Configuration Window
[Contents] [Index] [Top]
[Bottom] [Prev] [Next]
doc@platform.com
Copyright © 1994-1998 Platform Computing Corporation.
All rights reserved.