[Contents] [Index]
[Top] [Bottom] [Prev] [Next]
3. Generating Reports
About Reports
In LSF Analyzer, a report displays one or more statistics
on the Y-axis, measured against a single set of values on the X-axis.

The report contains the following elements:
- Data Source
- database containing the information used to generate the
statistics (the data source is specified when starting LSF Analyzer but is
not displayed in the report)
- Title
- user-specified title displayed on the report (optional)
- Y-axis
- statistics calculated by LSF Analyzer (maximum 7 per report)
- X-axis
- values (such as hosts, users, projects, or time periods) for which the statistics are calculated
- Report Range
- the period of time over which the statistics are calculated
- Chart Type
- the method of displaying the information (line chart, bar chart, area chart, or table format)
Selecting the Data Source
Each LSF cluster writes cluster information to a database, and this information is used to generate the LSF Analyzer reports. You will have multiple databases if old databases have been archived, or if you have multiple clusters. Before you can create a report, you must specify which database contains the information you want to analyze. By default, the database uses the same name as your cluster (e.g., cluster1).
To specify a database, take the following steps.
- Choose File | Select Data Source.
- In the Select Data Source dialog, select one data source, then click OK.
Y-axis Statistics
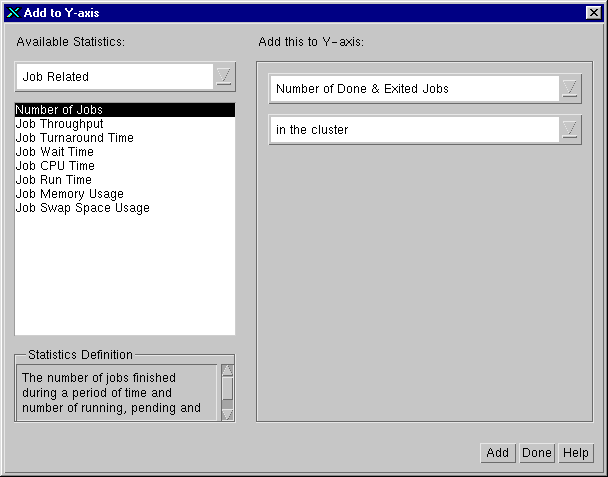
The statistics calculated by LSF Analyzer are chosen
in the Y-axis dialog. A report can display up to seven statistics against suitable
values of the X-axis.

There are two ways of interpreting Time on the X-axis, depending on the Y-axis statistics. Accumulated statistics use data accumulated over a user-specified time interval, and report the total or an average value. Sampled statistics use data that is sampled at a single point in time, and the data sampling is repeated at user-specified time intervals.
The statistics are sorted by categories and classes in the Y-axis dialog, which are described in detail in Appendix A, `Categories of Statistics', on page 59 and Appendix B, `Classes of Statistics', on page 61.
These tables show all the statistics available on the Y-axis. They are also listed alphabetically in Appendix C, `Statistics', on page 65.
The following statistics can be displayed over these X-axis values: Time (accumulated), Hosts, Host Types, Host Models, Queues, Users, Projects, Job Names, Job CPU Time Ranges, Job Memory Usage Ranges, and Job Swap Space Usage Ranges.
Statistic
|
Description
|
|---|
Number of Done and Exited Jobs
|
All finished jobs (includes both successful and failed jobs, but does not include running, pending, or suspended jobs).
|
Number of Done Jobs
|
Successful jobs (jobs that were successfully dispatched and completed without an error status).
|
Number of Exited Jobs
|
Failed jobs (jobs that were not successfully dispatched or exited with an error status).
|
The following statistics can be displayed over these X-axis values: Time (accumulated), Hosts, Host Types, Host Models, and Queues.
Statistic
|
Description
|
|---|
Job Throughput
|
The number of done and exited jobs divided by the time taken to finish these jobs (in jobs/hour).
|
The following statistics can be displayed over these X-axis values: Time (accumulated), Queues, Users, Projects, and Job Names.
Statistic
|
Description
|
|---|
Average Turnaround Time of Done & Exited Jobs
|
Average time from submission to completion for all finished jobs (in seconds).
|
Average Turnaround Time of Done Jobs
|
Average time from submission to completion for successful jobs (in seconds).
|
Average Turnaround Time of Exited Jobs
|
Average time from submission to completion for failed jobs (in seconds).
|
Average Wait Time of Done & Exited Jobs
|
Average time from submission to dispatch for all finished jobs (in seconds).
|
Average Wait Time of Done Jobs
|
Average time from submission to dispatch for successful jobs (in seconds).
|
Average Wait Time of Exited Jobs
|
Average time from submission to dispatch for failed jobs (in seconds).
|
The following statistics can be displayed over these X-axis values: Time (accumulated), Hosts, Host Types, Host Models, Queues, Users, Projects, and Job Names.
Statistics
|
Description
|
|---|
Average CPU Time of Done & Exited Jobs
|
Average time the CPU spent running each job in user mode and in kernel mode (in seconds).
|
Average CPU Time of Done Jobs
|
Average time the CPU spent running each successful job in user mode and in kernel mode (in seconds).
|
Average CPU Time of Exited Jobs
|
Average time the CPU spent running each failed job in user mode and in kernel mode (in seconds).
|
Total CPU Time of Done & Exited Jobs
|
Total CPU time spent running all jobs in user mode and in kernel mode (in seconds).
|
Total CPU Time of Done Jobs
|
Total CPU time spent running successful jobs in user mode and in kernel mode (in seconds).
|
Total CPU Time of Exited Jobs
|
Total CPU time spent running failed jobs in user mode and in kernel mode (in seconds).
|
Average Run Time of Done & Exited Jobs
|
Average time from dispatch to completion for all finished jobs (in seconds).
|
Average Run Time of Done Jobs
|
Average time from dispatch to completion for successful jobs (in seconds).
|
Average Run Time of Exited Jobs
|
Average time from dispatch to completion for failed jobs (in seconds).
|
Total Run Time of Done & Exited Jobs
|
Time from dispatch to completion, total for all finished jobs (in seconds).
|
Total Run Time of Done Jobs
|
Time from dispatch to completion, total for all successful jobs (in seconds).
|
Total Run Time of Exited Jobs
|
Time from dispatch to completion, total for all failed jobs (in seconds).
|
Average Memory Usage of Done & Exited Jobs
|
Average maximum resident memory used by processes of all finished jobs (in KB).
|
Average Memory Usage of Done Jobs
|
Average maximum resident memory used by processes of successful jobs (in KB).
|
Average Memory Usage of Exited Jobs
|
Average maximum resident memory used by processes of failed jobs (in KB).
|
Total Memory Usage of Done & Exited Jobs
|
Maximum resident memory used by all processes of a job, total for all finished jobs (in KB).
|
Total Memory Usage of Done Jobs
|
Maximum resident memory used by all processes of a job, total for successful jobs (in KB).
|
Total Memory Usage of Exited Jobs
|
Maximum resident memory used by all processes of a job, total for failed jobs (in KB).
|
Average Swap Usage of Done & Exited Jobs
|
Average maximum virtual memory used by processes of all finished jobs (in KB).
|
Average Swap Usage of Done Jobs
|
Average maximum virtual memory used by processes of successful jobs (in KB).
|
Average Swap Usage of Exited Jobs
|
Average maximum virtual memory used by processes of failed jobs (in KB).
|
Total Swap Usage of Done & Exited Jobs
|
Maximum virtual memory used by all processes of a job, total for all finished jobs (in KB).
|
Total Swap Usage of Done Jobs
|
Maximum virtual memory used by all processes of a job, total for successful jobs (in KB).
|
Total Swap Usage of Exited Jobs
|
Maximum virtual memory used by all processes of a job, total for failed jobs (in KB).
|
The following statistics can only be displayed over Time (accumulated) on the X-axis
Statistic
|
Description
|
|---|
CPU Utilization
|
The CPU time used over the last minute divided by the CPU time available in the same period (in percentage).
|
Memory Utilization
|
The amount of memory used divided by the total amount of memory available on the host (in percentage).
|
Swap Space Utilization
|
The amount of swap space used, divided by the total amount of swap space available on the host (in percentage).
|
Batch Job Slot Utilization
|
The number of used batch job slots divided by the maximum number of job slots on the host (in percentage).
|
Batch Processor Utilization
|
The number of used batch job slots divided by the number of processors on the host (in percentage).
|
15-second Run Queue Length
|
The 15-second exponentially averaged CPU run queue length.
|
1-minute Run Queue Length
|
The 1-minute exponentially averaged CPU run queue length.
|
15-minute Run Queue Length
|
The 15-minute exponentially averaged CPU run queue length.
|
Paging Rate
|
The memory paging rate exponentially averaged over the last minute (in pages/second).
|
Disk I/O Rate
|
The disk I/O rate exponentially averaged over the last minute (in KB/second).
|
Number of Login Users
|
The number of current login users.
|
Interactive Idle Time
|
For all logged in sessions, the amount of time during which the keyboard is not used (in minutes).
|
Available Memory
|
Amount of memory available (in MB).
|
Available Swap Space
|
Amount of swap space available (in MB).
|
Available /tmp Space
|
Amount of space available in the temporary directory (in MB).
|
User-specified external load indices
|
Any user-defined external dynamic numeric resource.
|
Usage of Resource Shared among Hosts
|
Total value of all instances for a dynamic shared resource.
|
The following statistics can only be displayed over Time (sampled) on the X-axis.
Statistic
|
Description
|
|---|
Num of Running, Pending & Suspended Jobs
|
Jobs in the system, either running or waiting to run
|
Num of Running & Suspended Jobs
|
Jobs which have been dispatched but not finished (running jobs or jobs in a suspended state)
|
Num of Pending Jobs
|
Jobs submitted but not yet dispatched.
|
Average CPU Time of Running & Suspended Jobs
|
CPU time used by each job, averaged for all jobs which have been dispatched but not finished (in seconds).
|
Total CPU Time of Running & Suspended Jobs
|
Total time the CPU has spent running jobs which have been dispatched but not finished, in user mode and in kernel mode (in seconds).
|
Average Memory Usage of Running & Suspended Jobs
|
Resident memory used by all processes in a job, averaged for all jobs which have been dispatched but not finished (in KB).
|
Total Memory Usage of Running & Suspended Jobs
|
Total resident memory used by all processes in jobs which have been dispatched but not finished (in KB).
|
Average Swap Usage of Running & Suspended Jobs
|
Virtual memory used by all processes in a job, averaged for all jobs which have been dispatched but not finished (in KB).
|
Total Swap Usage of Running & Suspended Jobs
|
Total virtual memory used by all processes in jobs which have been dispatched but not finished (in KB).
|
Number of Hosts in the Cluster
|
Number of LSF batch server hosts in the cluster.
|
Number of OK Hosts
|
Hosts able to accept batch jobs
|
Number of Busy Hosts
|
Overloaded hosts which are unable to accept batch jobs because some load indices go beyond the configured thresholds.
|
Number of Full Hosts
|
Hosts which are unable to accept batch jobs because the configured maximum number of batch job slots has been reached.
|
Number of Closed Hosts
|
Hosts which are unable to accept batch jobs for any of the following reasons: they are running an exclusive job, they have been locked by the LSF administrator, or they have been closed by the LSF administrator or its dispatch windows.
|
Number of Unavailable Hosts
|
Hosts which are unable to accept batch jobs because they are down, or their LIM/sbatchd is unreachable.
|
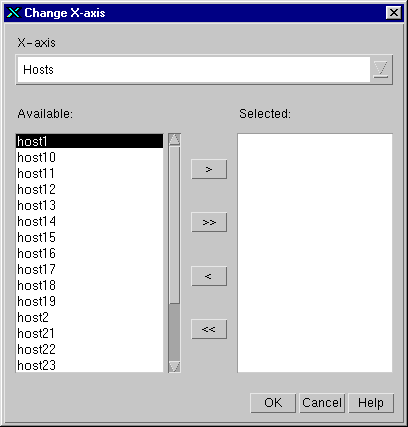
X-axis Values
The statistics you display on the Y-axis are measured
against values on the X-axis.

Statistics can be displayed against the following values:
- Time
- Hosts
- Host Types
- Host Models
- Queues
- Users
- Projects
- Job Names
- Job CPU Time Ranges
- Job Memory Usage Ranges
- Job Swap Space Usage Ranges
Report Range
You may choose to limit the report range so the report is generated faster, and so you can easily analyze data collected over a time period that is meaningful to you. You can specify the time and date of the start and end of the report range.
Accumulated statistics are calculated using data written to the database between the times and dates specified. By default, the statistics will be calculated using all of the data in the database.
Sampled statistics are displayed at regular intervals (specified in the Y-axis dialog) between the times and dates specified. By default, these statistics are displayed over the entire range of the data.
Creating Reports
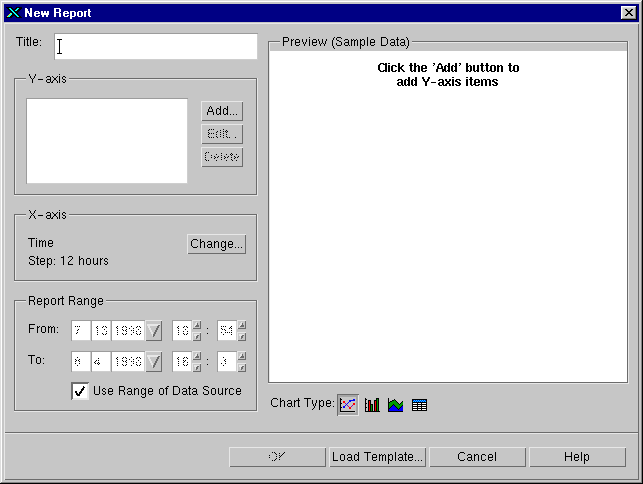
When creating a report, you can make changes to all the elements in the New Report dialog, until the report displays the information you want. The report is generated when you click OK, and the time it takes depends on the amount of data involved.
To create a new report, take the following steps:
- Choose File | New Report.
- Specify the title of the report.
- Click Add to specify the first statistic you want to display on the Y-axis. In the Y-axis dialog, select the category and class on the left side, then specify the statistic and scope on the right side.
Click Edit or Delete if you want to modify any of the Y-axis statistics you have selected.
You may include up to seven statistics in one report.
- Specify the values of the X-axis.
- Specify the Report Range. By default, the entire range of the database is
used.
- Specify the Chart Type (line chart, bar chart, area chart, or table format).
- Click OK.
It is easier to create a report from an existing template than it is to create a report from scratch. For more information, see `Using a Template to Create a Report' on page 29.
Modifying Reports
To modify the current report, take the following steps:
- Click the Modify button on the toolbar, or choose Report | Modify.
- In the Modify Report dialog, make any changes you want, then click OK.
For more information, see `Using a Template to Modify a Report' on page 30.
Printing Reports
To print the current report, take the following steps:
- Choose File | Print.
- In the Print dialog, specify printing parameters, then click OK.
Exporting Reports
To export data from the current report into a CSV (comma-separated) file, take the following steps:
- Choose File | Export.
- In the File Selection dialog, type or select the CSV file name, then click OK or Save.
[Contents] [Index]
[Top] [Bottom] [Prev] [Next]
doc@platform.com
Copyright © 1994-1998 Platform Computing Corporation.
All rights reserved.


