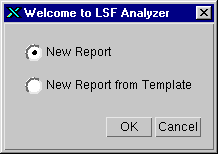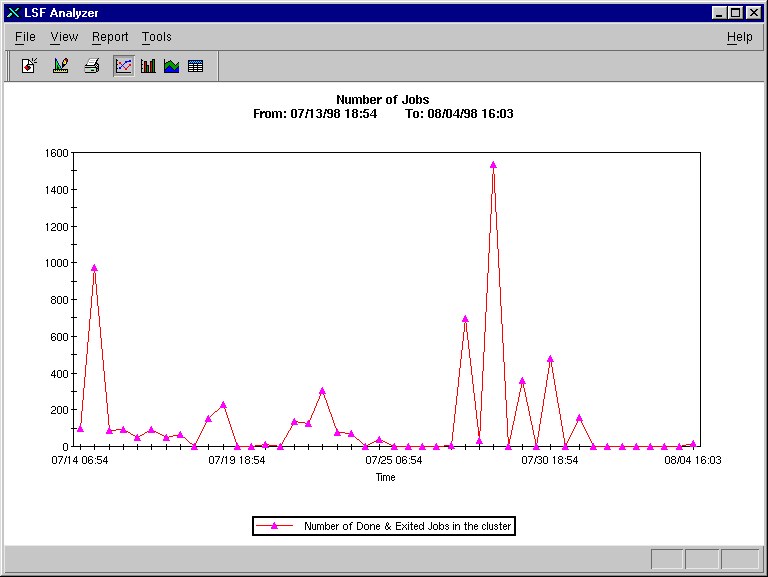
This chapter functions as a quick-start guide to begin using LSF Analyzer. The procedures in this chapter will provide you with experience using the various features of LSF Analyzer, by guiding you through the series of steps needed to generate a report.
A detailed explanation of the features and options for performing workload analysis is dealt with in the following chapters. Chargeback accounting is discussed in Chapter 5 , Chargeback Accounting, on page 33.
In this example, you will use the default template to create a report showing CPU usage for all users.

On UNIX enter the following command:% xanalyzer
If the command cannot be executed, the appropriate directories may need to be added to the systems path; check with the system administrator.
On Windows NT select:
Programs | LSF Suite for Workload Management | LSF Analyzer

To change the line chart to a bar graph, area graph or table select Report | Bar, Area, or Table.