The LSF system provides a powerful distributed computing environment that tightly integrates a suite of products: LSF Batch, LSF JobScheduler, LSF MultiCluster, LSF Analyzer, LSF Make, LSF Parallel, and LSF Base. While each of these products independently delivers great value collectively they constitute a complete workload management solution. LSF Analyzer is a tool for comprehensive workload and performance analysis.
LSF Analyzer processes historical workload data to produce reports about a cluster. The workload data includes information about batch jobs, system metrics, load indices and resource usage. LSF Analyzer provides system administrators and managers with the information to make intelligent, informed scheduling and capacity planning decisions required to fully utilize the power delivered by LSF.
LSF Analyzer can also be used to do chargeback accounting, generating chargeback reports and invoices.
The primary features of LSF Analyzer:
LSF Analyzer collects and analyzes historical data stored in the LSF database to produce statistical reports which are designed to suit your needs. The analysis can be displayed in table, bar, area and line charts, and can be saved as a template which makes it convenient to repeat the analysis any time.
The basic concepts used by LSF Analyzer:
The major advantage in using LSF Analyzer is it allows the LSF administrator to solve problems regarding the performance of the LSF cluster that would typically be very difficult to answer. Finding these solutions allows an LSF cluster to be configured and used optimally. Statistics generated by LSF Analyzer are used to show how well a system is working, and trend analysis helps with capacity planning.
Examples showing the benefits of LSF Analyzer:
Who are the largest consumers of system resources?
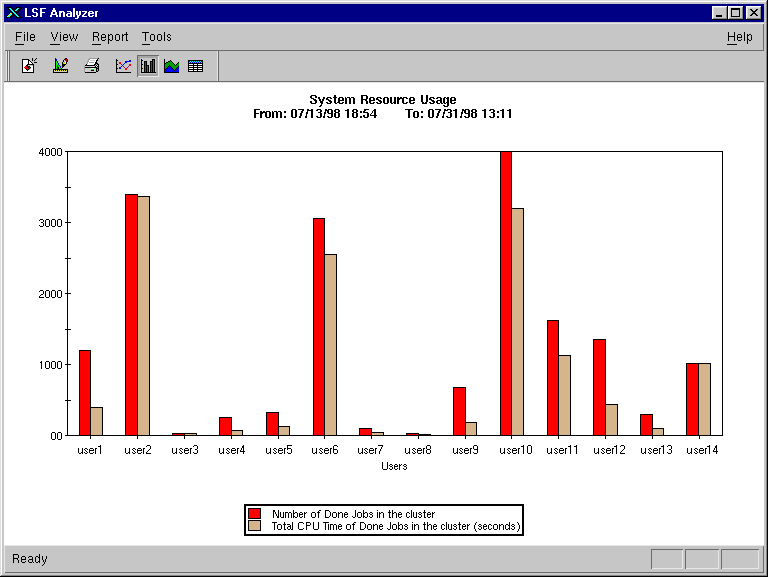
LSF Analyzer can be used to identify the users who are submitting CPU-intensive jobs or are submitting a large number of jobs. With this type of information the administrator can take corrective action to prevent these users from monopolizing cluster resources.
The report in Figure 1 shows the number of jobs submitted by each user and the CPU resources consumed by these jobs.
Figure 1. System Resource Usage

This report identifies the heaviest consumers of the LSF system resources. One possible action from this information is to implement fairshare policies to reduce the monopolization of system resources.
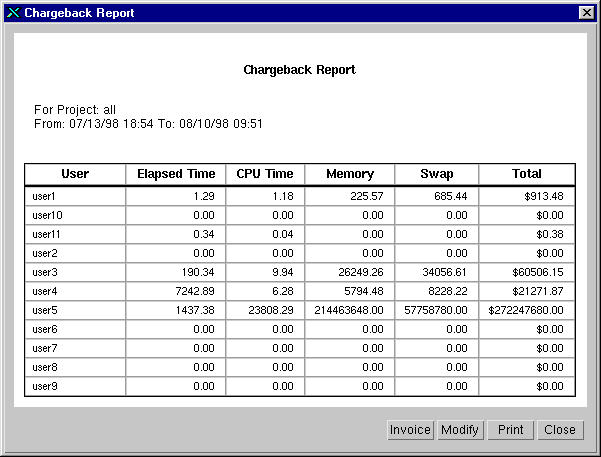
An extension of the user profile is the chargeback report shown in Figure 2.
Are the Host Resources being used efficiently?
LSF Analyzer can produce a host profile providing the justification to upgrade computing resource. Performance exceptions are identified in the cluster, like hosts that are not doing the expected amount of work due to hardware or configuration problems.
The report in Figure 3 compares the memory utilization and CPU utilization for host1.
Figure 3. Host Resource Utilization
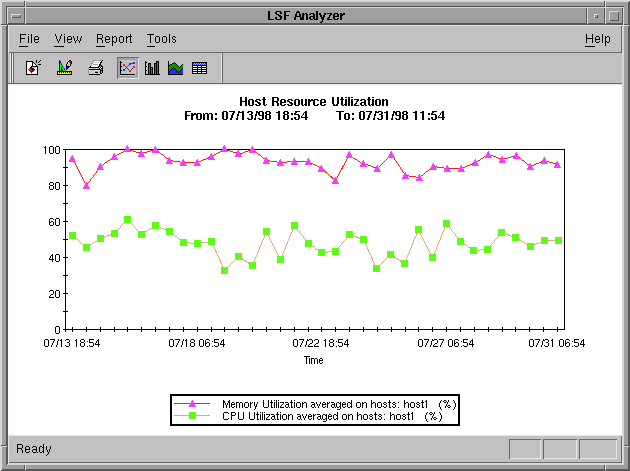
This example shows the memory for host1 is fully utilized but the available CPU resources are not. One conclusion drawn from this report is that there is not enough memory installed in host1. One possible corrective action would be to install additional memory resources, then rerun this report to verify CPU resources are being fully utilized.
Using LSF Analyzer to produce a cluster profile provides the information needed to demonstrate that service commitment levels were met.
The report shown in Figure 4 was produced using the /Performance/General/ClusterAvail_Time template.
Figure 4. Cluster Availability
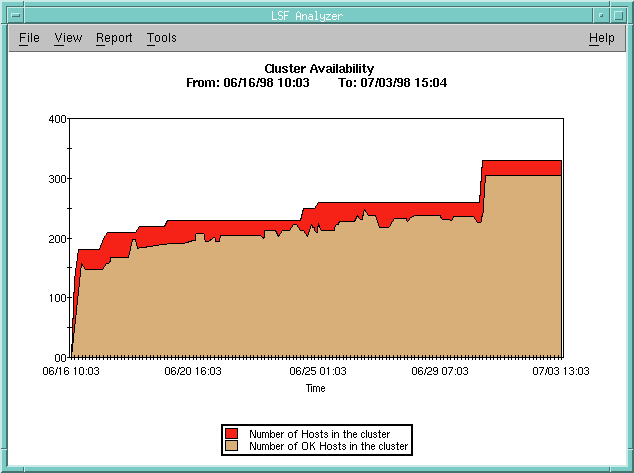
This report shows the number of OK hosts (available) in the cluster and the number of hosts (total) in the cluster. The large number of available (OK) hosts reflect the reliability of the cluster.
Using LSF Analyzer to produce a cluster profile highlighting user submission trends provides the information needed to schedule regular maintenance and system downtime.
The report shown in Figure 5 was produced using the /Workload/General/Job_Time template.
Figure 5. Number of Running and Suspended Jobs in the Cluster
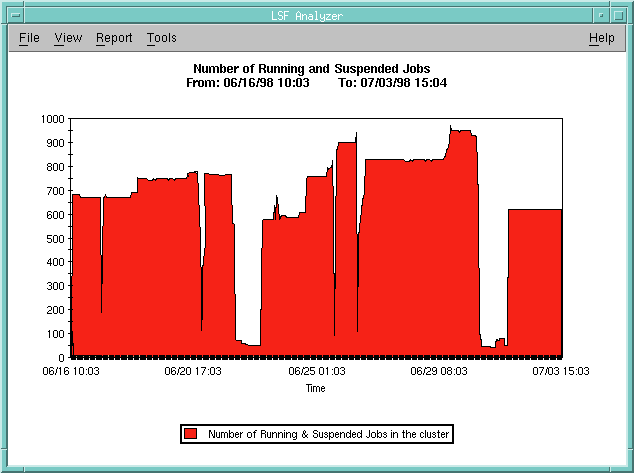
This report shows the number of running and suspended jobs in the cluster which represents the times of maximum and minimum system usage. This example shows that patterns of low system usage occur on a regular basis.